Cycles and intercycles, applications and separations, concentrations and dispersions, conjunctions and oppositions: positions of slow moving planets and state of the world. Presentation of a forecasting method based on the positions of slow-moving planets.
The following study is an extension of the article that Jean-Pierre Nicola devoted in 1979 to forecasting methods. It uses the same method: it involves measuring the concentration or dispersion index of slow-moving planets (from Jupiter to Pluto) on the ecliptic. It is based on the same interpretative principle, the hypothesis being the following: the highlights of collective destiny should be punctuated by periods of maximum concentration. As Nicola noted, “whatever planetary index one imagines, whatever method one adopts, common sense requires studying one that contains them all: that of the velocities of the constituent elements. It is obviously the angular velocity specific to each planet that modifies the profile of a graph of angular spaces treated differently (addition, subtraction, power, etc.).”
In his 1979 article, Nicola had calculated, using the ephemerides, the increase in zodiacal longitude of each of the slow planets of the 1st January to 31st December of each year from 1963 to 2001, the number obtained giving the average annual angular velocity. To obtain the annual variation of each intercycle of planets taken two by two (5 planets × 2 = 10 intercycles), it suffices to calculate the difference in velocities and to take into account the fact that the planets are either in application (of l opposition to conjunction), or in separation (from conjunction to opposition). The intercycles in application (the fastest planet moving towards the slowest after entering the opposition phase with it) are assigned a positive coefficient: they are added to each other. We then proceed to the ratio of the totals: sum of the planets in application divided by the sum of the global angular variations. We do not forget that the planets do not progress regularly, according to perfect circles: their real speeds depend on the ellipses formed by their orbits: acceleration when the planet approaches the Sun — from aphelion (farthest) to perihelion (nearest) —, deceleration when it moves away from it (from perihelion to aphelion). It is therefore necessary to calculate a relative average of the angular velocities, which is obtained by dividing the sum of the annual angular distances by this average and ideal speed (135° 72′), as if the planetary orbits were circular.
Example
From 01/01/1991 to 31/12/1991, Jupiter moved 32° 39′, Saturn 10° 05′, Uranus 3° 53′, Neptune 2° 04′ and Pluto 2° 29′. Intercycles are calculated as follows:
▶ Jupiter-Saturn: 32° 39′ − 10° 05′ = 22° 34′
▶ Jupiter-Uranus: 32° 39′ − 03° 53′ = 28° 46′
▶ Jupiter-Neptune: 32° 39′ − 02° 04′ = 30° 35′
▶ Jupiter-Pluton: 32° 39′ − 02° 29′ = 30° 10′
▶ Saturn-Uranus: 10° 05′ − 03° 53′ = 06° 12′
▶ Saturn-Neptune: 10° 05′ − 02° 05′ = 08° 00′
▶ Saturn-Pluton: 10° 05′ − 02° 29′ = 07° 36′
▶ Uranus-Pluton: 03° 53′ − 02° 29′ = 01° 24′
▶ Uranus-Neptune: 03° 53′ − 02° 05′ = 01° 48′
▶ Neptune-Pluton: 02° 29′ − 02° 05′ = 00° 24′
Total: 137° 29′
This figure corresponds to the sum of the displacements of the intercycles in one year. In 1991, Jupiter in Leo applies to Pluto in Scorpio and to Uranus, Neptune and Saturn in Capricorn. Uranus applies to Neptune, while Saturn and Uranus separate from Pluto. The sum of the intercycles in application is therefore the following:
▶ Jupiter-Saturn: 22° 34′
▶ Jupiter-Uranus: 28° 46′
▶ Jupiter-Neptune: 30° 35′
▶ Jupiter-Pluton: 30° 10′
▶ Uranus-Neptune: 01° 48′
▶ Neptune-Pluton: 00° 24′
Total: 111° 17′
Note that Pluto in Scorpio applies to Neptune in Capricorn, whereas, in the sense of the Signs, Neptune should separate from Pluto: this is explained by the fact that currently, the orbit of Pluto at perihelion crosses that of Neptune and therefore Pluto is closer to the Sun than Neptune, therefore faster.
By dividing the total intercycles in application by the total intercycles, we obtain the concentration index: 111° 17′ / 137° 29′ = 0.77, value that we report on the abscissa of the graph. Finally, the actual speed / average speed ratio is calculated: 137.50 / 135.72 = 1.01. To obtain the relative average, we divide this figure by two: 1.01 / 2 = 0.505 = average. 0.77 being greater than 0.505, we deduce that a maximum of intercycles were in the application phase.
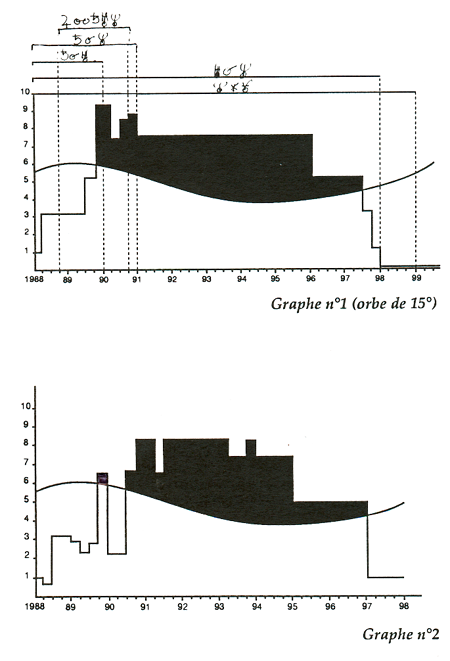 To build the following graphs, the same basic method was used, except: after having calculated the variation of the angular displacements of 1st January to 31st December of each year, here I have taken into account quarterly variations (from 1st of the month to the 30th or 31st of the last month of each quarter). The annual total of intercyclical variations is kept; the calculation of the total intercycles in effect during each quarter results from the application of the annual average to the quarterly intercyclical variations. As a result, retrogradations are not precisely taken into account. This method makes it possible to obtain a more detailed evaluation of the phenomena of concentration-dispersion.
On the other hand, instead of strictly measuring the exact moment of application or separation — which is not possible with a method that measures annual or quarterly elongations — I have accepted an orb of 15° before and after the exact conjunction and opposition aspects, which concretely means that at −15° or +15° from these aspects, the planets concerned are considered to be in their period of application. This method, which places excessive value on the applications, nevertheless has the advantage, in terms of representation, of better showing, at the top of the graph, the major aspects (conjunctions, oppositions) of the intercycles of the slow planets. Moreover, the orb is arbitrary: why not 5° or 10°? Moreover, how to rationally explain orbs that uniformly overlap periods of acceleration and deceleration?
Relative and provisional answers: the choice of 15° of orb: 5°, it is undoubtedly too small (otherwise, why would we admit orbs of up to 18° for conjunctions, oppositions in individual charts?).
On the one hand, the choice to attribute an orb to the intercycles stems from the desire to construct a graph expressing both the concentration-dispersion rates of the slow planets and the real duration of the major aspects (conjunction, opposition), which is in relation to the ratio of the speeds of the planetary couples in intercycle and the periods of retrogradation (since these calculations are geocentric, therefore a function of the optics). In the years in which Jupiter successively enters into opposition with the other slow-moving planets, the graph rises faster and earlier above the average, better reflecting the “tensions”; similarly, when the graph is lowered, we can better perceive the “triggers” reflected by the successive conjunctions of Jupiter at the “slow”. The highlights of the intercycles are thus visually reintegrated into the graph.
On the other hand, the choice to attribute an orb can be understandable from the point of view of physical laws: when a planet is between 170° and 190° of its cycle (phase of opposition), who can say which laws facts apply to this phenomenon? It is probably naive to believe that at 180° 00′ exactly, its speed, theoretically defined during this instant “T” as “nothing”, radically changes properties. At 180° + or − x°, shortly before the end of the acceleration and shortly after the start of the deceleration, there is certainly a complex speed phenomenon which integrates (sense of combinations…) acceleration and deceleration (idem for the conjunction)… Hence the (relative) legitimacy of these “orbs”…
Finally, it can be objected that no difference is made, in the assignment of the orbs of the aspects, between planets in application and in separation (the aspects of the first should be, according to tradition and certain astrological observations, broader in orb than seconds). Tentative answers: 1) to simplify the calculations, I took a uniform orb; 2) my experience in individual astrology has so far not convinced me of the validity of this law: in practice, large orbs of identical extents before or after the faster of two planets in aspect seem to be justified, some (orbs Before the exact aspect) seeming to encourage more discovering and actualizing the effects of the aspect, and the others (orbs after the exact aspect) to manage them, all within the general framework of the conditionalist theory of aspects.
Finally, these calculations suffer from a major defect: having been carried out using geocentric ephemeris, they remain dependent on the optical effects specific to the terrestrial observatory (retrogradations for example).
Graph No. 1 is both quantitative (it measures the rate of concentration or dispersion of slow planets) and qualitative (relative arbitrary of the orb assigned to the different intercycles in aspect). As an indication, graph No. 2, purely quantitative, strictly measures (without orb) the concentration-dispersion rates during the same period on the basis of an annual average calculation. The upper “plateau”, above the sinusoid representing the average velocities, indicates that a maximum of slow planets are in the application phase. Graph No. 2 is more “shredded” than No. 1: the record of applications and separations being made on 1st day of each beginning of the quarter, all it takes is one retrograde planet for the quotations to fall sharply – and artificially; in heliocentric, there are no retrogradations… Graph No. 1 shows us that at the turn of 1989 and 1990, we were in a high point in history, which does not appear clearly at the reading of graph No. 2. By account, the two graphs lead, not only to the same general profile, but also to the same result from the point of view of interpretation: the current collective crisis would not end until around 1995… Finally, at the very top of graph No. 1, the major aspects of the nits and their durations are indicated (orb of 100).
The method, applied in the 19th century, gives the following highlights: 1800–1806 (the victorious epic of Napoleon and his great European and Middle Eastern upheavals); 1812–1819 (end of the 1st Empire, with defeats in Russia, Europe, multiple wars of independence in Latin America); 1827–1831 (Greek-Turkish War, conquest of Algeria by France); 1838–1844 (Opium War between China and England, annexation of India and Aden by England); 1850–1854 (Taiping revolt in China, Crimean War, warlike birth of South Africa, second French Empire); 1866–1869 (conquest of the Indochinese countries by France, Prussian-Austrian war, conquest of Turkestan by Russia); 1876–1881 (Russian-Turkish war in the Balkans, Boer war against the English, conquest of Black Africa by France).
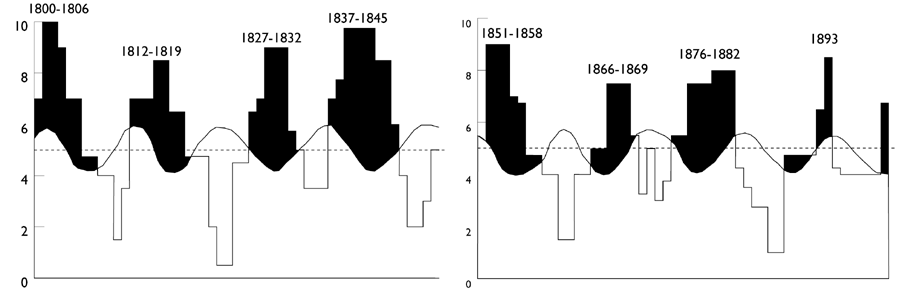
Most of the founding events of modern history are therefore located in the “Tops” of the graph. On the other hand, one can wonder why the American Civil War (1861–1865), the European revolutionary conflagration of 1848, among others, are in the “down” of the graph… Which amounts to posing the following problem: how, and according to which criteria, to quantify the major collective events? Some, spectacular in their time, see their probable effects vanish into history. Others, apparently relatively benign, retrospectively weigh very heavily on the collective future. To these phenomena must be added the ever-increasing interpenetration of international problems (globalization of the economy, “planetary village”) which we have been witnessing since the end of the 19th century. Before about 1800, indeed, global crises were rare, and most collective warm-ups retained a local dimension. As noted by Jean-Pierre Nicola, “men are not the puppets of the sky, even if the relationship with the geosolar atmosphere, at a certain level, is close. Long before the astral strings, there are those of other men organized into groups and ideologies justifying the domination of some by others.” Interpretation in global astrology must take into account these objective conditions which profoundly transform historical development.
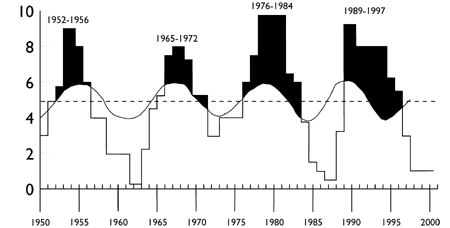
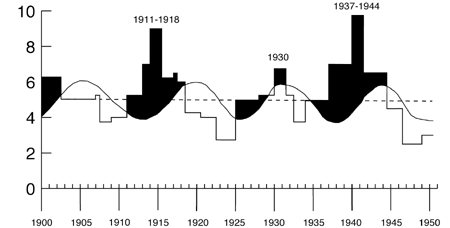 Applied to 20th century, the method gives the following highlights: 1900–1902 (Boxer War, Boer War); 1911–1917 (World War I, Bolshevik Revolution); 1937–1942 (World War II); 1951–1956 (Korean War, beginnings of the EEC, de-Stalinization, independence of Laos and Cambodia, partition of Vietnam after the Dien-Bien-Phu disaster, Nasser’s coup in Egypt); 1966–1970 (Indo-Pakistani war, cultural revolution in China, Israeli-Arab Six-Day War, intensification then end of the Vietnam War, May 1968, Soviet intervention in Czechoslovakia); 1977–1983 (1st election of the European parliament by universal suffrage, Islamic revolution in Iran, general shift of political powers in Western democracies, the wind of madness of economic liberalism, the left in power in France, Falklands war, Russian-Afghan war, war in Lebanon, Iraqi-Iranian war, flash start of the Japanese economic war in the United States)… And finally, 1989–1995 (fall of the Berlin wall, collapse of communism, reunification of Germany, Gulf war, chaos in Union Soviet, for now and to begin with). To be monitored and predicted for the same period, by analyzing the likely development of current tensions: impact of the Gulf War on Arab and Muslim regimes, explosion of Islamic fanaticism with its procession of wars and migrations (all the more that Islam seems “connected” to the Saturn-Uranus-Neptune intercycle), difficult birth of economic and monetary Europe or its dramatic failure, a few wars in the Balkans, implosion of the broken Empire, contained or not by a military-industrial dictatorship in the USSR and the East-West tensions it would entail, exacerbation of the Euro-Japanese and American-Japanese economic war, tremendous upheavals in China following the death of Deng Xiaoping, economic decline and economic and racial tensions in the USA, widespread famines and conflicts in Africa, new conflicts in Southeast Asia, perhaps an Indo-Pakistani war.
 Some, reading these sinister enumerations, would be tempted to think either that planetary concentration = war, or that I am a terrible pessimist who exaggerates the darkness of human things. Let us therefore recall in passing that, in this type of graph, it is the fastest planet (here Jupiter) which primarily structures the variations in amplitude of the curve. It is therefore a question of reading the graph according to jupiterian values: short-term fluctuations of the politico-economic struggles for the maintenance or the overthrow of power. The dominant of the interpretation, if we stick to the intercycles of Saturn, Uranus, Neptune and Pluto, would be saturnian. We will come back to this in a future study.
Planetary concentrations do not necessarily and systematically imply a “warrior response” widespread on the part of mankind. But the latter being what it is, divided, torn into a multitude of ethnic, geographical, religious, ideological, political, economic communities of faith and interest (not to mention the quarrels of the astrological chapels), wars, localized or are so far the type of “solution” most frequent during times of collective tension. We may regret it, but that’s the way it is.
We have the right to be more optimistic. From this point of view, World War II made it possible to strengthen and cement representative democracy in the Western camp and to see the emergence of a UN with greater powers… but it was after, in the descent of the graph. During the great planetary concentration of 1977–1983 (with this method and from a strictly astronomical point of view, it is the peak of the century, the longest and the strongest rate of concentration), many had been the Cassandres who had prophesied an apocalyptic world war, which fortunately did not take place. In an optimistic vision, we can retain a strong revival of the European Union, the end — temporary? — of the Khmer Rouge in Cambodia, the Camp David agreements ending the war between Israel and Egypt, the death of Brezhnev in the USSR and his replacement by Andropov, a timid precursor to perestroika.
Realistic if not pessimistic side, let us nevertheless retain in the same period a multiplication of local conflicts and the intensification of the world economic war… which is a form of modern war and “civilized” like another. By being optimistic therefore (without forgetting that the periods of relative “calme” collective are very clearly located in the hollows of the graph, we can hope, for the period which awaits us, during and more surely after the hard current and future conflicts: the beginning of a planetary awareness to solve the problems North-South, a more rational and less unjust if not egalitarian world economic organization, the extension of democracies, a strong comeback of the UN (the wisdom of nations?)… With hyper-rosy glasses: the miserable and fanatical Muslims transforming in the next five years into peaceful consumers-sheep, democratic-television and non-sexist, the Japanese refraining from launching a major economic offensive on disunited Europe, the Soviet Union metamorphosing into a prosperous Commonwealth, the Africa coming out of its torpor, its corruption and its famines, etc. Absolute miracles category: scientists stop squandering their gray matter in the manufacture of nuclear weapons and in genetic tampering, a peaceful and community-based ecolo-hedonic society is set up on a global scale, and astrology once again becomes queen Sciences. We can always dream…
See you between 1995 and 2000, when the graph descends. To be continued then… SEE ALSO
Article published in issue No. 16 of the Cahiers conditionalistes (July 1990).
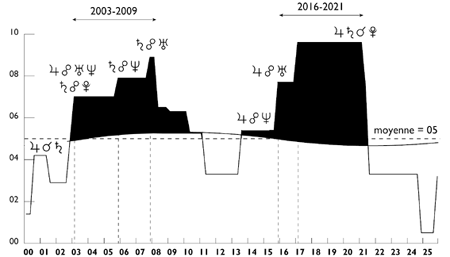 This graph, made in 1990, represents the timeline of slow planets for the period 2000–2005. It is characterized by two major periods of concentration, in 2003–2009 and 2016–2021.
▶ The most critical phase of the period 2003–2009, which saw China become a gigantic global exporter and the intensification of Islamic terrorism, is between 2007 and 2009. It corresponds, among other things, to the outbreak of the most violent economic and financial crisis since that of 1929.
▶ The 2016–2021 period promises to be eminently critical and dangerous. It should correspond to very significant global upheavals which could for a long time call into question the balances and imbalances inherited from the 2003–2009 phase. A new violent economic and financial crisis is likely, against a backdrop of very strong international tensions.
▶ Global astrology: a method
▶ Declination concentration-dispersion index
▶ Could astrology predict the stock market crash of October 2008?
▶ Élizabeth Teissier’s avian flu
▶ Conditioning in global astrology
▶ Élizabeth Teissier, Pluto in Scorpio & the AIDS epidemic
▶ Thoughts on global astrology
Les significations planétaires
par
620 pages. Illustrations en couleur.
La décision de ne traiter dans ce livre que des significations planétaires ne repose pas sur une sous-estimation du rôle des Signes du zodiaque et des Maisons. Le traditionnel trio Planètes-Zodiaque-Maisons est en effet l’expression d’une structure qui classe ces trois plans selon leur ordre de préséance et dans ce triptyque hiérarchisé, les Planètes occupent le premier rang.
La première partie de ce livre rassemble donc, sous une forme abondamment illustrée de schémas pédagogiques et tableaux explicatifs, une édition originale revue, augmentée et actualisée des textes consacrés aux significations planétaires telles qu’elles ont été définies par l’astrologie conditionaliste et une présentation détaillée des méthodes de hiérarchisation planétaire et d’interprétation accompagnées de nombreux exemples concrets illustrés par des Thèmes de célébrités.
La deuxième partie est consacrée, d’une part à une présentation critique des fondements traditionnels des significations planétaires, d’autre part à une présentation des rapports entre signaux et symboles, astrologie et psychologie. Enfin, la troisième partie présente brièvement les racines astrométriques des significations planétaires… et propose une voie de sortie de l’astrologie pour accéder à une plus vaste dimension noologique et spirituelle qui la prolonge et la contient.
Téléchargez-le dès maintenant dans notre boutique
Pluton planète naine : une erreur géante
par
117 pages. Illustrations en couleur.
Pluton ne fait plus partie des planètes majeures de notre système solaire : telle est la décision prise par une infime minorité d’astronomes lors de l’Assemblée Générale de l’Union Astronomique Internationale qui s’est tenue à Prague en août 2006. Elle est reléguée au rang de “planète naine”, au même titre que les nombreux astres découverts au-delà de son orbite.
Ce livre récapitule et analyse en détail le pourquoi et le comment de cette incroyable et irrationnelle décision contestée par de très nombreux astronomes de premier plan. Quelles sont les effets de cette “nanification” de Pluton sur son statut astrologique ? Faut-il remettre en question son influence et ses significations astro-psychologiques qui semblaient avérées depuis sa découverte en 1930 ? Les “plutoniens” ont-ils cessé d’exister depuis cette décision charlatanesque ? Ce livre pose également le problème des astres transplutoniens nouvellement découverts. Quel statut astrologique et quelles influences et significations précises leur accorder ?
Enfin, cet ouvrage propose une vision unitaire du système solaire qui démontre, chiffes et arguments rationnels à l’appui, que Pluton en est toujours un élément essentiel, ce qui est loin d’être le cas pour les autres astres au-delà de son orbite. Après avoir lu ce livre, vous saurez quoi répondre à ceux qui pensent avoir trouvé, avec l’exclusion de Pluton du cortège planétaire traditionnel, un nouvel argument contre l’astrologie !
Téléchargez-le dès maintenant dans notre boutique